The Investigator Advantage
Delta Relative Strength
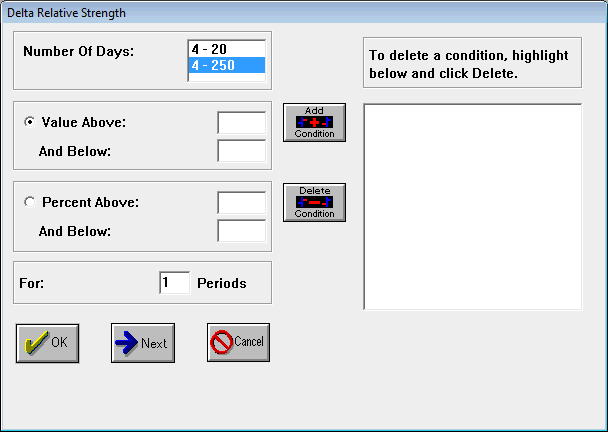
Delta Relative Strength is an indicator that shows which financial
instruments are moving up or down the
Relative Strength lists for a particular time period. For example, an
instrument that has the past four Relative Strength values of 90, 90, 90 and
90 is interesting, but how about an instrument that has the past four
Relative Strength values of 20, 30, 40, and 50? Clearly, for momentum
traders, this could be the start of a big move. One might not notice this
trade because it appears at the bottom of the Relative Strength lists.
Alternatively, Delta Relative Strength could be used as an indicator for
exiting trades if the instrument dropped below a certain DRS value. The
instruments that are rising the fastest on the Relative Strength lists are
given a value of 99, while the instruments that are declining the fastest on
the Relative Strength lists are given a value of 1. Investigator allows you
to generate these values over multiple time periods. The most popular
periods are 4 and 6 periods. Investigator also allows you to see the percent
change the instrument made over the Relative Strength periods. You can use
both the Delta Relative Strength value and the percent change value in
testing.
Click Next to see the next Delta Relative Strength testing dialog box.
Click Next to see the next Delta Relative Strength testing dialog box.