The Investigator Advantage
Point-And-Figure
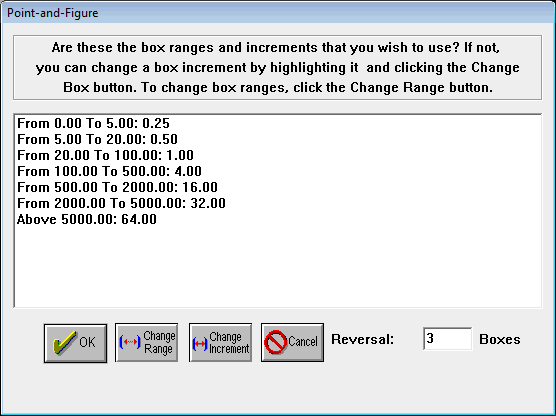
Point-And-Figure is a charting technique that was developed by Charles Dow.
It was traditionally composed of lines that were made up of X’s and O’s.
(Investigator uses colors to distinguish the lines instead.) The height of
each X and O box is based on a price range that is user determined. For
example, if a price of a financial increment is between 5 and 20, the box
height is 0.5 by default, while if prices are between 20 and 100, the box
height is 1 by default. Point-And-Figure charting is unique in that a bar
does not represent a specific date. New bars are created only if prices have
reversed a certain number of boxes.
You can click on the Change Range or the Change Increment button to see the associated dialog boxes.
Click OK to see the pre-defined Point-And-Figure patterns.
Click Cancel to return to the Main Testing Dialog Boxes.
You can click on the Change Range or the Change Increment button to see the associated dialog boxes.
Click OK to see the pre-defined Point-And-Figure patterns.
Click Cancel to return to the Main Testing Dialog Boxes.