For years, investors have been trying to find a way to objectively and mechanically define the trend of a financial instrument. Also, investors have been trying to find stop loss techniques that will lock in profits, but will also allow the market some movement. The Gann trend indicator (GTI) addresses both these needs. For this example, we are going to assume a two close GTI.
The Gann trend indicator is drawn and its stops are determined in the following manner. Investigator starts at the beginning of the chart and moves forward in time looking for two up or two down closes in a row.
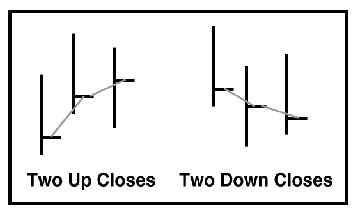
Two up closes is defined as a bar that has it’s close higher than the previous bar’s close, and the previous bar’s close higher than two bar’s ago close. Similarly, two down closes is defined as a bar that has it’s close lower than the previous bar’s close, and the previous bar’s close lower than two bar’s ago close. If you have a three close GTI, you would have to have three consecutive closes higher or lower.
When there are two up closes or down closes in a row, we enter the GTI loop. Let’s assume the chart starts with two down closes. Now Investigator starts looking for up down closes. Once this happens, Investigator finds the lowest low since the two down closes, subtracts the Move percent value from the low, and draws a line from the two down closes to the two up closes at this value:
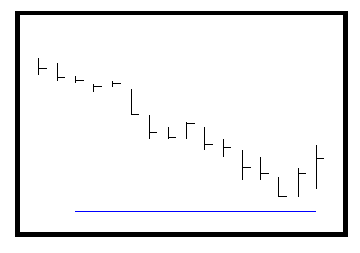
This line represents the GTI long stop for future bars. The Move percent value allows for a little market flexibility so your stops won’t be prematurely hit.
Now Investigator starts looking for two down closes. Once this happens, Investigator finds the highest high since the two up closes, adds the Move percent value to the high, and draws a line from the two down closes to the two up closes at this value:
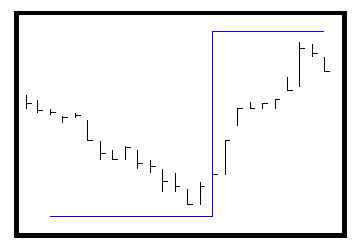
This line represents the GTI short stop for future bars.
Once again, Investigator starts looking for up down closes. Once this happens, Investigator finds the lowest low since the two down closes, subtracts the Move percent value from the low, and draws a line from the two down closes to the two up closes at this value:
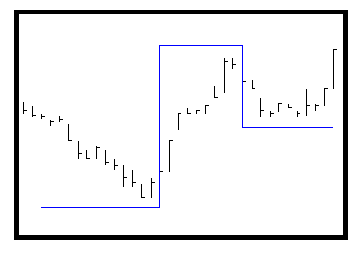
This line represents the new GTI long stop for future bars.
The loop continues until the end of the chart. Note: It takes two to three iterations of the loop before the GTI values are correct and available. The beginning iterations of the loop are ignored during historical testing and should be ignored when viewing a file.
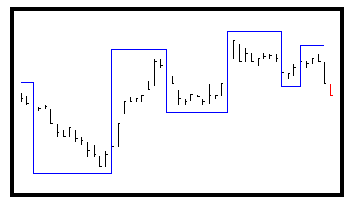
Note how the market decides where the stops are placed. In the above example, if you are long, you will not be stopped out until the price on a bar drops below the long stop value, as shown below.
Trend is determined by looking at the past two GTI short stop and long stop lines. If the recent short stop line is higher than the previous short stop line and the recent long stop line is higher than the previous short stop line, the trend is UP.
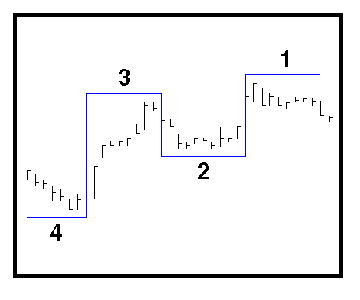
In the above picture, since the recent short stop line (line 1) is higher than the previous short stop line (line 3) and the recent long stop line (line 2) is higher than the previous long stop line (line 4), the trend is UP.
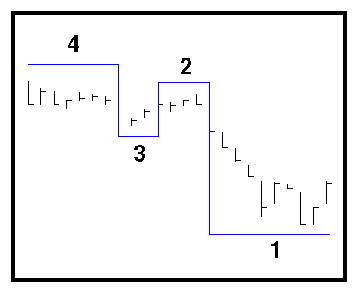
If the recent short stop line (line 2) is lower than the previous short stop line (line 4) and the recent long stop line (line 1) is lower than the previous long stop line (line 3), the trend is DOWN.
If neither of the above two cases apply, the trend is none.
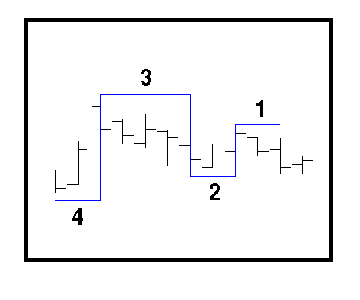
The recent short stop line (line 1) is lower than the previous short stop line (line 3) but the recent long stop line (line 2) is higher than the previous short stop line (line 4), so the trend is NONE.
Reference: None