Alphabetical Search:
above / below value
absolute value
add
add conditions dialog box
add system dialog box
adding - a data directory
adding - and deleting a relative strength directory
adding - a data type or directory information
adding - a group and file
adding - a system to your system library
adding - indicators to a chart
adding - trades to your trades list
all charts
and
and then within
arc tangent
ascending triangle up
ascending triple top
backup - creating
backup - restoring
backup - support files
bad data - conditions
bad data - finding files
bad data - viewing files
bar
bar chart or separate window
bar pattern - conditions
bar pattern - creating
bar pattern - name dialog box
bar pattern - number of bars dialog box
bar pattern - recall, delete, edit
bar pattern - visual editor
bar stop
bar stop testing dialog box
bearish catapult
bearish resistance line up
bearish signal formation down
bearish signal reversed down
bearish support line down
bollinger bands
bollinger bands calculation
bollinger bands - designer
bollinger bands testing dialog box
bullish catapult
bullish resistance line up
bullish signal formation up
bullish signal reversed up
bullish support line down
calculation examples - bollinger bands
calculation examples - check open
calculation examples - delta relative strength
calculation examples - directional movement index
calculation examples - ease of movement
calculation examples - entry stop
calculation examples - equity curve
calculation examples - group relative strength
calculation examples - hard stop
calculation examples - historical volatility
calculation examples - MACD histogram
calculation examples - MACD regular
calculation examples - moving averages
calculation examples - on balance volume
calculation examples - percent retrace
calculation examples - point and figure
calculation examples - rate of change
calculation examples - relative strength
calculation examples - relative strength index
calculation examples - stochastics
calculation examples - target profit
calculation examples - time stop
calculation examples - trading ranges
calculation examples - trailing stop loss
candlesticks
capital management
capital management parameters
ceiling
changing - data type and directory information
changing - data types
changing - defaults
changing - favorite indicators
changing - group and file information
changing - point and figure range or box values
changing - preferred data type
changing - the current (delta) relative strength directory
changing - to daily data
changing - to monthly data
changing - to weekly data
changing - the number of bars on chart
charts - adding indicators
charts - bar information
charts - changing the number of bars
charts - changing to daily data
charts - changing to monthly data
charts - changing to weekly data
charts - mouse actions
charts - moving indicator windows
charts - one by one
charts - opening
charts - printing
charts - recall system
charts - redo view
charts - removing indicator windows
charts - scrolling
charts - undo view
charts - zooming in
charts - zooming out
check futures symbols
check open
check open - calculation
check open - testing dialog box
close gap cpr down
close gap cpr up
conditions - bad data
conditions - entry / exit
configuring the toolbar
cosine
creating - a backup
creating - industry groups
creating - investor defined bar patterns
database manager overview advanced - relative strength
database manager overview - relative strength
database overview (delta) relative strength
data types - adding a data directory
data types - changing
data types - changing data types and directory information
data types - data types and groups overview
data types - finding
data types - overview
data types - preferred
defaults - indicator defaults dialog boxes
delayed price target
delayed price target - calculation
delayed price target - testing dialog box
deleting - a data type or directory
deleting - and adding a relative strength directory
deleting - a group and file
deleting - trades on trades list
deleting - and viewing delta relative strength values
deleting - and viewing relative strength values
delta relative strength
delta relative strength - calculation
delta relative strength - changing the current directory
delta relative strength - database overview
delta relative strength - designer
delta relative strength - directory
delta relative strength - generating delta relative strength values
delta relative strength - generating (d)rs values using rs database manager
delta relative strength - main overview
delta relative strength - testing dialog box
delta relative strength - viewing and deleting delta relative strength values
descending triangle down
descending triple bottom
designer bar chart or separate window
designer dialog boxes
designer file open dialog box
designer functions dialog box
designer functions overview
designer indicator
designer line values for graph window
designer main dialog box
designer menu selection
designer name dialog box
designer number of bars and indicator color
designer number of lines for graph window
designer overview
designer recall, delete, expand
designer testing dialogs
designer - absolute value
designer - add
designer - and
designer - arc tangent
designer - bar
designer - bollinger bands
designer - ceiling
designer - cosine
designer - delta relative strength
designer - designer indicator
designer - directional movement index
designer - divide
designer - ease of movement
designer - else
designer - equal
designer - exponent
designer - floor
designer - fraction
designer - greater than
designer - greater than equal
designer - group delta relative strength
designer - group relative strength
designer - highest high
designer - historical volatility
designer - if
designer - less than
designer - less than equal
designer - logarithm
designer - lowest low
designer - macd histogram
designer - macd regular
designer - midpoint
designer - modulus
designer - moving averages
designer - multiply
designer - negative
designer - not equal
designer - on balance volume
designer - or
designer - power
designer - precision
designer - previous value
designer - rate of change
designer - relative strength
designer - relative strength index
designer - round
designer - running total
designer - sine
designer - square root
designer - standard deviation
designer - start condition
designer - subtract
designer - stochastics
designer - tangent
designer - then
designer - volume
directional movement index
directional movement index calculation
directional movement index - designer
directional movement index testing dialog box
directory - adding a data directory
directory - adding, deleting, or using
directory - (delta) relative strength
divergence
divide
double bottom
double top
ease of movement
ease of movement calculation
ease of movement - designer
ease of movement testing dialog box
editing trades
else
enter / exit close
entry stop
entry stop calculation
entry / exit conditions review
equal
equity curve
equity curve calculation
exchange - giving
exchange - taking
exiting Investigator
exponent
files - adding, deleting, or using in groups
files - opening
finding - data files and directories
finding - files with bad data
finding - finding indicators
finding - finding systems
floor
fraction
fundamental analysis
futures - check symbols
futures - lookup table
futures - view unknown symbols
Gann Trend Indicator
Gann Trend Indicator - testing dialog box
Gann - twenty four never failing rules
gap down
gap up
generating - delta relative strength values
generating - (d)rs values using rs database manager
generating - group delta relative strength values
generating - group relative strength values
generating - relative strength values
greater than
greater than equal
group delta relative strength
group delta relative strength - designer
group delta relative strength - generating group delta relative strength values
group relative strength
group relative strength calculation example
group relative strength - designer
group relative strength - generating group relative strength values
group relative strength testing dialog box
groups - changing group and file information
groups - creating industry groups
groups - data types and groups overview
groups - generating group delta relative strength values
groups - generating group relative strength values
groups - view unknown symbols
hard stop
hard stop calculation
highest high
historical test log
historical testing - above / below value
historical testing - add conditions dialog box
historical testing - add system dialog box
historical testing - capital management parameters
historical testing - divergence
historical testing - entry / exit conditions review
historical testing - historical test log
historical testing - main historical testing dialog box
historical testing - overview
historical testing - past results library
historical testing - pre-defined bar patterns overview
historical testing - pre-defined point and figure overview
historical testing - re-testing currently defined system
historical testing - re-testing the recent test system
historical testing - re-test system dialog box
historical testing - show just entry/exit conditions
historical testing - system name dialog box
historical testing - test parameters
historical testing - test results
historical testing - testing dialog box
historical testing - TradeWindow
historical volatility
historical volatility calculation
historical volatility - designer
historical volatility testing dialog box
if
ignore entry prices
ignore entry prices testing dialog box
index
indicators - and
indicators - and then within
indicators - bar stop
indicators - bollinger bands
indicators - candlesticks
indicators - changing favorite
indicators - check open
indicators - delayed price target
indicators - delta relative strength
indicators - directional movement index
indicators - ease of movement
indicators - enter / exit close
indicators - entry stop
indicators - equity curve
indicators - finding indicators
indicators - Gann Trend Indicator
indicators - group delta relative strength
indicators - group relative strength
indicators - hard stop
indicators - historical volatility
indicators - ignore entry prices
indicators - index
indicators - MACD histogram
indicators - MACD regular
indicators - major pivots
indicators - moving averages
indicators - new high
indicators - new low
indicators - overview
indicators - on balance volume
indicators - or
indicators - percent retrace
indicators - pivot points
indicators - point and figure
indicators - rate of change
indicators - relative strength
indicators - relative strength index
indicators - Revised Gann Trend Indicator
indicators - seasonal
indicators - showing favorite
indicators - specific day
indicators - stochastics
indicators - target profit
indicators - time stop
indicators - trading ranges
indicators - trailing stop loss
indicators - volume
inside bar down
inside bar up
integer
Investigator - philosophy
Investigator - finding systems
Investigator - success formula
investor defined patterns - conditions
investor defined patterns - creating
investor defined patterns - name dialog box
investor defined patterns - number of bars dialog box
investor defined patterns - recall, delete, edit
investor defined patterns - visual editor
island reversal down
island reversal up
just crossed
less than
less than equal
logarithm
lookup - futures table
lookup - ticker symbol
lowest low
MACD histogram
MACD histogram calculation
MACD histogram - designer
MACD histogram testing dialog box
MACD regular
MACD regular calculation
MACD regular - designer
MACD regular testing dialog box
main designer dialog box
main historical testing dialog box
major pivots
major pivots - testing dialog box
midpoint
modulus
mouse actions on a chart
moving averages
moving averagse calculation
moving averages - designer
moving averages testing dialog box
moving indicator windows
moving the toolbar
multiply
negative
new five bar highs and closes
new five bar lows and closes
new high
new high - testing dialog box
new low
new low - testing dialog box
not equal
notes for beginning investors - fundamental analysis
notes for beginning investors - overview
notes for beginning investors - random walk theory
notes for beginning investors - technical analysis
number of bars
number of bars ago
number of bars on charts - changing
number of lines for graph window
of what
on balance volume
on balance volume calculation
on balance volume - designer
on balance volume testing dialog box
or
opening charts / files
outside bar down
outside bar up
overview - data types and groups
overview - finding systems
overview - indicators
overview - notes for beginning investors
overview - philosophy
overview - pre-defined bar patterns
overview - pre-defined point and figure overview
overview - (delta) relative strength database
overview - relative strength database manager
overview - statistics
overview - success formula
overview - trades list
past results library
patterns - creating investor defined bar patterns
patterns - bar pattern conditions
patterns - name dialog box
patterns - number of bars dialog box
patterns - recall, delete, edit
patterns - visual editor
percent retrace
percent retrace calculation
percent retrace testing dialog box
philosophy
pivot points
pivot points - testing dialog box
point and figure
point and figure calculation
point and figure changing range or box values
point and figure testing dialog box
power
precision
pre-defined bar patterns - close gap cpr down
pre-defined bar patterns - close gap cpr up
pre-defined bar patterns - gap down
pre-defined bar patterns - gap up
pre-defined bar patterns - inside bar down
pre-defined bar patterns - inside bar up
pre-defined bar patterns - island reversal down
pre-defined bar patterns - island reversal up
pre-defined bar patterns - new five bar highs and closes
pre-defined bar patterns - new five bar lows and closes
pre-defined bar patterns - outside bar down
pre-defined bar patterns - outside bar up
pre-defined bar patterns - overview
pre-defined bar patterns - reversal bar down
pre-defined bar patterns - reversal bar up
pre-defined bar patterns - reversal gap down
pre-defined bar patterns - reversal gap up
pre-defined bar patterns - three bar close reversal down
pre-defined bar patterns - three bar close reversal up
pre-defined bar patterns - three bar equalibrium reverse down
pre-defined bar patterns - three bar equalibrium reverse up
pre-defined point and figure patterns overview
pre-defined point and figure patterns - ascending triangle up
pre-defined point and figure patterns - ascending triple top
pre-defined point and figure patterns - bearish catapult
pre-defined point and figure patterns - bearish resistance line up
pre-defined point and figure patterns - bearish signal formation down
pre-defined point and figure patterns - bearish signal reversed down
pre-defined point and figure patterns - bearish support line down
pre-defined point and figure patterns - bullish catapult
pre-defined point and figure patterns - bullish resistance line up
pre-defined point and figure patterns - bullish signal formation up
pre-defined point and figure patterns - bullish signal reversed up
pre-defined point and figure patterns - bullish support line down
pre-defined point and figure patterns - descending triangle down
pre-defined point and figure patterns - descending triple bottom
pre-defined point and figure patterns - double bottom
pre-defined point and figure patterns - double top
pre-defined point and figure patterns - overview
pre-defined point and figure patterns - spread triple bottom
pre-defined point and figure patterns - spread triple top
pre-defined point and figure patterns - symmetrical triangle down
pre-defined point and figure patterns - symmetrical triangle up
pre-defined point and figure patterns - triple bottom
pre-defined point and figure patterns - triple top
preferred data type
previous value
printer setup
printing - charts
printing - printer setup
quotes - viewing
random walk theory
rate of change
rate of change calculation
rate of change - designer
rate of change testing dialog box
recall system
redo view
relative strength
relative strength - add / delete directory
relative strength - calculation
relative strength - changing the current directory
relative strength - database manager advanced
relative strength - database manager overview
relative strength - database overview
relative strength - designer
relative strength - directory
relative strength - generating (d)rs values using rs database manager
relative strength - generating relative strength values
relative strength - main overview
relative strength - testing dialog box
relative strength - viewing / deleting values
relative strength index
relative strength index - calculation
relative strength index - designer
relative strength index - testing dialog box
removing indicator windows
restoring a backup
re-test system dialog box
re-testing - currently defined system
re-testing - recent test system
reversal bar down
reversal bar up
reversal gap down
reversal gap up
review system library test - charts
review system library test - list
Revised Gann Trend Indicator
Revised Gann Trend Indicator - testing dialog box
round
rs database manager - overview
rs database manager - advanced
rs database manager - generating (d)rs values
running total
scrolling charts
seasonal
seasonal testing dialog box
show just entry/exit conditions
showing favorite indicators
sine
specific day
specific day testing dialog box
spread triple bottom
spread triple top
square root
statistics
standard deviation
start condition
stochastics
stochastics calculation
stochastics - designer
stochastics testing dialog box
subtract
success formula
support
support files backed up or restored
symmetrical triangle down
symmetrical triangle up
system definition
system library - adding a system
system library - definition
system library - recall, delete, use
system library - review test charts
system library - review test list
system library - testing
system library - testing dialog box
system name dialog box
systems - adding a system to your system library
systems - definition
systems - finding systems
systems - historical testing overview
systems - library definition
systems - menu overview
systems - recall system
systems - re-testing currently defined system
systems - re-testing the recent test system
systems - re-test system dialog box
tangent
target profit
target profit calculation
target profit testing dialog box
technical analysis
test parameters
test results
testing dialog box - bar stop
testing dialog box - bollinger bands
testing dialog box - check open
testing dialog box - delayed price target
testing dialog box - delta relative strength
testing dialog box - directional movement index
testing dialog box - ease of movement
testing dialog box - Gann Trend Indicator
testing dialog box - group relative strength
testing dialog box - historical volatility
testing dialog box - ignore entry prices
testing dialog box - just crossed
testing dialog box - MACD histogram
testing dialog box - MACD regular
testing dialog box - moving averages
testing dialog box - major points
testing dialog box - new high
testing dialog box - new low
testing dialog box - number of bars
testing dialog box - number of bars ago
testing dialog box - on balance volume
testing dialog box - percent retrace
testing dialog box - pivot points
testing dialog box - point and figure
testing dialog box - rate of change
testing dialog box - relative strength
testing dialog box - relative strength index
testing dialog box - Revised Gann Trend Indicator
testing dialog box - seasonal
testing dialog box - specific day
testing dialog box - stochastics
testing dialog box - target profit
testing dialog box - time period
testing dialog box - time stop
testing dialog box - trading ranges
testing dialog box - trailing stop loss
testing dialog box - volume
testing dialog boxes - just crossed
testing dialog boxes - number of bars
testing dialog boxes - number of bars ago
testing dialog boxes - time period
then
three bar close reversal down
three bar close reversal up
three bar equalibrium reverse down
three bar equalibrium reverse up
ticker symbol lookup
time period
time stop
time stop calculation
time stop testing dialog box
toolbar - configuring
toolbar - moving
trades list - adding trades
trades list - all charts
trades list - charts - one by one
trades list - deleting trades
trades list - editing trades
trades list - list
trades list - overview
TradeWindow
trading ranges
trading ranges - calculation example
trading ranges - testing dialog box
trailing stop loss
trailing stop loss - calculation
trailing stop loss - testing dialog box
triple bottom
triple top
twenty four never failing rules
undo view
user defined patterns - conditions
user defined patterns - creating
user defined patterns - name dialog box
user defined patterns - number of bars dialog box
user defined patterns - recall, delete, edit
user defined patterns - visual editor
viewing - bad data files
viewing - bar information
viewing - and deleting delta relative strength values
viewing - and deleting relative strength values
viewing - quotes
viewing - unknown futures symbols
viewing - unknown groups symbols
volume
volume - designer
volume testing dialog box
zooming - in on charts
zooming - out on charts
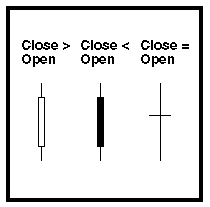
Candlesticks
Candlestick patterns have become extremely popular in recent years. They are simply bar patterns in which the open is also taken into account. They are also drawn differently than regular bar charts. The area between the open and close for a bar is drawn as a box and is called the body. If the close for the day is higher that the open, the box is white. If the close for the day is lower that the open, the box is black. If there is no difference between the open and the close, a line is drawn instead of a box. The high and low for the bar are drawn as usual.
Candlesticks can be easily incorporated into historical or end-of-day testing by using the Bar Pattern Visual Editor .
Note: If you are viewing a chart that has candlesticks on the chart, but you don’t see the candlesticks, you probably have too many bars on the chart. You can correct this by zooming in on the chart.